Last week FileMaker Inc. announced FileMaker Pro 11 — and most early reviewers agree the most exciting new capability is charting. In the weeks to come I’ll be digging in and providing demo files for some cool uses of this important new tool.
If you already chart in FusionCharts or xmChart or 360Works Charts or AnyChart or xmChart or Maani or Google API or SimpleChart or [your unnamed favorite here], you will still find the built-in chart tool easier to use than any of those. It is amazingly convenient. And did I mention easy? If you’re not a charting fan yet, then I’m sure you soon will be.
That said, this IS the first version with charting built-in, so it would be good to keep expectations modest.
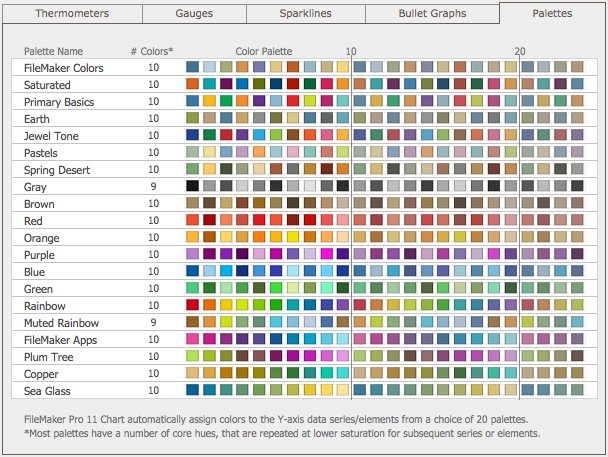
For example, FileMaker Pro 11 Chart automatically assign colors to the Y-axis data series/elements from a choice of 20 palettes. Unlike the advanced third-party charting options, you cannot assign a specific color to a particular data point.
However there are ways to get around the default color choices (for one, by fabricating null data series), so it is handy to know the spectrum of colors available. That is not easily discovered unless you plot every possibility. So we did. Or at least the first 50 colors of each palette.
So I can tell you that most palettes have ten core hues, which are repeated at lower saturation for subsequent series or elements. But see for yourself. Grab this screenshot or download the .fp7 file to catch a glimpse.