Haven’t seen Part 1a yet? Read it here.
Our Charting Legacy
To help us plot our trendline trajectory into the future, please accompany me on a short stroll down memory lane. Reaching back almost twenty years, I’ve been able to collect a few stories about those early days. The first makers of charts in FileMaker Pro truly were pioneers. In the early- and mid-1990s Reinhold Stadelmann and Brian Dunning were wrestling with Cartesian coordinate systems in an heroic fashion. Their successes became the foundation on which FileMaker charting rested for nearly a decade.

So in this spirit and from the perspective of mid-2011, please enjoy my retrospective wanderings.
~Lee Lukehart
ChartMaker Pro, by Brian Dunning http://www.briandunning.com
It seems that Brian has always been keenly aware of market needs, and in the mid-1990s he applied his considerable technical talents towards addressing the unmet need for a charting solution that did not require a plug-in to function. There is nothing inherently wrong with plug-ins, of course — they simply provide a different set of advantages and drawbacks. As is often the case, the value of the trade-offs varies by situation.
Most plug-ins require installation on each user’s machine, and they are typically licensed to cover a certain number of users. Hence they increase the acquisition and maintenance cost. Compatibility — current and in the future — may also present a downside. We also had to endure the the problem of getting the plug-in to fire automatically when data changed; this could be a huge issue with charting, where it is highly desirable to have up-to-date graphs. But thanks to script triggers introduced in FileMaker Pro 10, automatic updating is no longer a major issue.
So when ChartMaker Pro debuted towards the end of 1997, it was a big deal that its calculation-driven charts responded immediately to data changes. Brian’s product deservedly snagged the cover of the Dec. 97 / Jan. 98 issue of FileMaker Advisor magazine. ChartMaker Pro was again in the limelight at the 2004 DevCon when FileMaker Pro 7 was introduced; it was one of the finalists for the FileMaker Idol contest. It had been updated to the .fp7 file format and schema, and showcased the Evaluate() function, new in FileMaker Pro 7.
ChartMaker Pro now has company in the charting arena, including the built-in chart object that arrived with FileMaker Pro 11 and the web viewer included in FileMaker Pro 8.5. For almost a decade ChartMaker Pro and xmCHART provided the main charting options for FileMaker Pro users. ChartMaker Pro is now at version 7v3 and is still sold (pricing starts at $39.95) and supported — and it may be the best or only option for older installations.
Big THANK YOUs go out to both Brian and Reinhold for their vision, effort, and ongoing promotion of charting for FileMaker Pro!
Editor’s Sidebar: The BEST FEATURES EVER!
During FileMaker Pro’s long history, there are perhaps a dozen features that truly were game-changers. They changed our behaviors and then our expectations. They shook up the way we thought about what we could do with FileMaker, and with software in general. Compared to the tens of thousands of improvements the smart and kind (and sometimes quirky) folks at FileMaker Inc. have provided, these dozen qualify as quantum paradigm shifts. Now, my list of 12 may differ slightly from yours, and I don’t wish to get into a debate and derail you from perusing the other fine resources in this EVERYTHING REFERENCE 4 that Andy Gaunt and company have put together.
Okay I’ll give you one: script triggers. If you haven’t cozied up to them yet, don’t wait. They’ll rock your world. Seriously. Ask anyone who is using them.
Here’s another —absolutely my favorite feature from FileMaker Pro 9: layout object autoresize. You laugh? Okay, that one may not be on your list and I don’t want to fight about it. There are plenty of other improvements you can pick for your list. I just know that I never want to go back to that set-in-stone-one-size-fits-all world.
Okay, let’s try one more: the web viewer object.
Ah, I knew we would agree on that one. Not only can the web viewer exude extreme coolness, but it is one of the hardest-working features I know in FileMaker. It was terrific when it came out in FileMaker Pro 8.5, and it just keeps getting better. In my memory I hear the words of RIck Kalman, product manager (at the time) of the 8.5 release: “We know this (web viewer) has potential, but who knows where it will go? We can’t wait to see what (the developer community) does with it.” Prophetic words, Rick. I hope we’re doing you proud.
[/Sidebar]
ICE, by iSolutions, Inc. http://www.isolutions-inc.com
The date is August 14, 2006. The place, Orlando, Florida. Welcome to DevCon! FileMaker Pro 8.5 was announced one month ago, and the keynote session is entitled “Bringing FileMaker Solutions to the Web.” One of the busiest people at the conference is iSolutions president and founder Cris Ippolite. Cris had just written the white paper on the web viewer and had created ICE — a charting tool that combines the rich visual experience of Adobe Flash with the data exchange power of XML. After the keynote session where ICE was demoed, he is in high demand at his booth in the product showcase.
Cris is a master of Adobe Flash and speaks regularly at Flash Forward, the developer conference for the Flash platform. It is no coincidence that Cris possesses a skillset ideally suited for the convergence of FileMaker and Flash. He has been working towards this point for the last five years, finding ways to integrate Flash with FileMaker to meet various client needs.
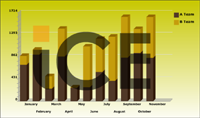
In October 2006, iSolutions announced that ICE was available as a hosted service. With the ICE Charting Service customers could create, view and share visually stunning bar, column, pie, line, radar, scatter and area charts live from anywhere on the Web. The remote Flash files can be accessed via the web viewer (or any browser, really) and the interface facilitates chart customization and configuration. The conduit is the URL string, which looks something like:
http://ice.isolutions-inc.com/chart/iceChart.swf?

icKey=&icDim=3D;;fadeIn;maj-min;maj-min

&icTitleChart=;,,;Verdana;5;

&icTitleX=;,,;Verdana;6;bold

&icTitleY=;,,;Verdana;6;bold

&icBackground=;,,,,,;Gradient;200,200,0,255,255,255

&icLegend=right;0,0,0;Verdana;7;bold

&icSeriesDef=A%20Team;column;stacked;;none;80,56,39

|B%20Team;column;stacked;;none;197,157,12

&icSeriesData=January,711;February,908;March,242;

April,870;May,264;June,273;July,570;August,397;

September,848;October,940;November,841

|January,172;February,95;March,244;April,543;

May,6;June,795;July,645;August,860;September,794;

October,466;November,798
Pricing is variable by tier based on number of users, starting at $39 per user for a 2-year term. The ICE Charting Flash-based service remains available as a charting solution, although you can bet that Cris is in the vanguard with the emerging HTML5 technologies.
360Works Chart, by 360Works http://www.360works.com
However, iSolutions ICE wasn’t the only charting technology launched at DevCon that year. 360Works released a charting plug-in, initially giving it away free to great fanfare. President Jesse Barnum and team have produced a suite of plug-ins written in Java — or more precisely, in Groovy — an object-orient scripting language for Java that runs on the Java Runtime Engine (JRE).
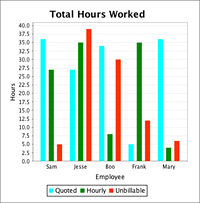
Contrasted with xmCHART’s method for creating images, 360Works Chart runs more like a traditional plug-in where a series of 20+ routines are provided as External Functions in the Specify Calculation dialog. These are called from within a script or calculation (see example), where the elements are progressively assembled. The chart is then rendered and displayed by the final [charttype]ShowChartGraphic() external function.
Let(

debug = timeSeriesChartCreate( "Total Hours Worked" ; "Employee" ; "Hours" ) and

timeSeriesChartSetDataPoint( "Quoted" ; date 1 ; Quoted 1 ) and

timeSeriesChartSetDataPoint( "Quoted"; date 2 ; Quoted 2 ) and

timeSeriesChartSetDataPoint( "Quoted" ; date 3 ; Quoted 3 ) and

timeSeriesChartSetDataPoint( "Quoted" ; date 4 ; Quoted 4 ) and

timeSeriesChartSetDataPoint( "Quoted" ; date 5 ; Quoted 5 ) and
timeSeriesChartSetDataPoint( “Hourly” ; date 1 ; Hourly 1 ) and
timeSeriesChartSetDataPoint( “Hourly”; date 2 ; Hourly 2 ) and
timeSeriesChartSetDataPoint( “Hourly” ; date 3 ; Hourly 3 ) and
timeSeriesChartSetDataPoint( “Hourly” ; date 4 ; Hourly 4 ) and
timeSeriesChartSetDataPoint( “Hourly” ; date 5 ; Hourly 5 ) and
timeSeriesChartSetDataPoint( “Unbillable” ; date 1; Unbillable 1 ) and
timeSeriesChartSetDataPoint( “Unbillable”; date 2 ; Unbillable 2 ) and
timeSeriesChartSetDataPoint( “Unbillable” ; date 3 ; Unbillable 3 ) and
timeSeriesChartSetDataPoint( “Unbillable” ; date 4 ; Unbillable 4 ) and
timeSeriesChartSetDataPoint( “Unbillable” ; date 5 ; Unbillable 5 ) and
timeSeriesChartSetSeriesColor( “Quoted” ; Color Quoted::red ; Color Quoted::green ; Color Quoted::blue ; alpha ) and
timeSeriesChartSetSeriesColor( “Hourly” ; Color Hourly::red ; Color Hourly::green ; Color Hourly::blue ; alpha ) and
timeSeriesChartSetSeriesColor( “Unbillable” ; Color Unbillable::red ; Color Unbillable::green ; Color Unbillable::blue ; alpha ) and
If (showRegression ; timeSeriesChartAddRegression( “Quoted” ) ; 1 )
;
If (debug ;
timeSeriesChartShowGraphic(
360;
360 ;
“outline=” & outline ;
“legend=” & legend ;
)
360Works offers chart licenses for Workgroups (10 users) at $95 flat, Enterprise (single-site unlimited and server-side scripting) for $395, or as a Solution Bundle License (for unlimited distribution with your solution) for $595. The current version of the plugin is 1.7 (as of mid-2011).
SimpleChart, by 24U s.r.o. http://www.24usoftware.com
At the beginning of 2007, a client request compelled HOnza Koudelka and team to survey the market for a charting solution. Their conclusion was that no existing option provided both the power and ease of use they sought. 24U has built a brand around a series of plug-ins (e.g. SimpleDialog, SimpleFile, SimpleHelp, etc.) designed to be broadly capable and easily implemented. So it was only natural for them to build their own plug-in for charting.
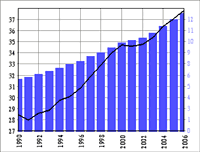
HOnza says their #1 design goal was straightforward: Create a charting plug-in that would be unbeatably easy to use. He wanted it to use a single simple calc that would automatically generate and format a chart. I think you’ll agree that they succeeded admirably. The following formula is all that’s needed to produce a chart:
SChart_Style(

SChart_Data(

SChart_Data( "Year"; "GDPpCa"; RGB ( 0; 255; 255 ) ) ;

"Year"; "GDP"; RGB ( 0; 0; 255 ) ) ;

"ComboLineVBar" )
Pricing is also simple, with a flat license fee starting at US$48, plus $24 for each additional user at a site. The current version is 1.2.1.
“The Evolution of (FileMaker) Charting, Part 1” will be made available in its entirety,
in the Everything Reference 4 published by FMPUG.org.
[to be continued] Next up: The world is flat; Fusion Global flashes onto the FileMaker scene